EN
EN FRENCH
 繁体中文
繁体中文


What Data Aggregation Is and Why It Matters
Every click, every transaction, every online interaction generates data—mountains of it. Left unprocessed, it’s chaos. Imagine trying to make sense of millions of scattered puzzle pieces without a picture on the box. Overwhelming, right? That’s exactly where data aggregation steps in. It turns raw, unwieldy information into clear, actionable insights you can actually use. If you’re new to analytics, “data aggregation” might sound like tech jargon. But the concept is surprisingly intuitive. This guide will take you through the full picture of data aggregation, explaining what it is, how it works, where it’s applied in the real world, and the common pitfalls to avoid. By the end, you will understand how this process turns raw information into actionable insights.

What Exactly Is Data Aggregation
At its simplest, data aggregation is the process of collecting data from multiple sources and condensing it into a summary that's easy to digest. The goal? Take mountains of detailed information and distill it into actionable insights.
Picture an e-commerce website. Every click, purchase, page visit, and user interaction generates data—millions of points each day. Analyzing each individually is impossible. Instead, data aggregation allows you to summarize this information into metrics like:
Total daily sales
Average order value
Unique visitors
Top-selling products
Suddenly, you're no longer drowning in data—you're steering with clarity. Data aggregation is the backbone of business intelligence, turning a flood of raw numbers into insights that drive real decisions.
Key Features of Effective Data Aggregation
Data aggregation isn't just collecting numbers—it's collecting them right. Effective aggregation has four crucial features:
Summarization: Transform raw data into meaningful summaries using sums, averages, counts, or other metrics. Less noise, more insight.
Scalability: Modern data grows fast. Your aggregation system must handle huge volumes and high-speed data without slowing down.
Automation: Manual processing is a nightmare. ETL pipelines (Extract, Transform, Load) automate collection, cleaning, and summarization on a schedule—hourly, daily, or real-time.
Consistency and Standardization: Data arrives in different formats. Standardizing ensures dates, units, and categories align, giving you trustworthy results.
The Mechanics of Data Aggregation
Think of data aggregation as a four-stage workflow, turning raw chaos into structured insight.
Stage 1: Data Collection
Everything starts here. You gather data from internal sources like CRMs and sales databases or external ones like social media feeds and public APIs. Quality here dictates quality downstream.
Stage 2: Data Processing (Transformation)
Raw data is messy. This stage cleans it:
Remove duplicates
Correct errors
Fill missing values
Normalize formats (currency, dates, text case)
Stage 3: Storage and Summarization
Cleaned data goes into a data warehouse or data lake. Aggregation happens here—grouping, summarizing, and condensing into usable statistics.
Stage 4: Presentation and Visualization
Finally, present your data in dashboards, reports, or charts. A clear visualization makes trends obvious and insights actionable.
Real-World Examples
Data aggregation is everywhere—here's how industries leverage it:
Finance: Firms combine global stock data to track trends, assess risk, and guide investments.
Marketing: Campaign data from multiple platforms is aggregated to calculate ROI and optimize performance.
E-commerce: Retailers analyze customer behavior to predict demand, optimize inventory, and boost sales.
Healthcare: Aggregated hospital data identifies disease outbreaks and resource needs.
Supply Chain: Logistics firms track routes, delivery times, and costs to streamline operations.
Why Data Aggregation Matters
Data aggregation isn't optional—it's critical. Here's why:
High-Level Analysis: See the big picture beyond individual data points.
Smarter Decisions: Summaries empower faster, more confident choices.
Efficiency: Automated aggregation saves time, reducing errors and freeing analysts for higher-value work.
Predictive Insights: Aggregated historical data fuels forecasting and predictive analytics.
Challenges to Consider
Aggregation is powerful—but not without hurdles:
Data Quality: Poor inputs yield poor outputs. Garbage in, garbage out.
Volume and Velocity: Big data requires robust storage and processing.
Diverse Sources: Integrating disparate formats and APIs is tricky.
Governance: Policies must guide ethical and responsible data handling.
Data Aggregation With Swiftproxy
Collecting global, unbiased web data is tough—but crucial. That's where Swiftproxy shines:
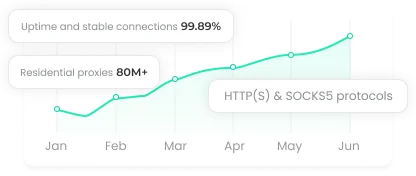
Vast, Diverse Network: Over 80 million residential IPs for global coverage and unbiased datasets.
Precise Geo-Targeting: Gather location-specific insights for market research or pricing.
High-Quality Collection: Residential IPs mimic real users, ensuring reliable, authentic data.
By using Swiftproxy, your data aggregation starts strong, producing insights that are accurate, representative, and actionable.
Conclusion
Data aggregation transforms chaos into clarity. It's the invisible engine behind business dashboards, marketing analytics, and financial summaries. Understanding its features, processes, and applications allows even beginners to see its power. Challenges exist—but with the right tools and approach, organizations can unlock the immense value hidden in their data and turn it into actionable intelligence.
About the author
Related articles


- Please provide your account number, or email address.
- Provide videos or screenshots, and simply describe the problems you are facing.
- Our staff will reply to your message within 24 hours.