EN
EN FRENCH
 繁体中文
繁体中文


How Data Aggregation Simplifies Complex Analytics
A single enterprise generates millions of data points every day. Clicks. Transactions. Logins. Support tickets. The problem is not access to data anymore. The problem is turning that noise into something you can actually act on. Raw information is chaotic. It sits in dashboards, spreadsheets, CRM systems, analytics tools, payment processors, and server logs. Alone, each source tells part of the story. Together, they can drive strategy. That transformation process is called data aggregation, and it quietly powers nearly every serious analytics operation in modern business.

What Data Aggregation Means
Data aggregation is the process of collecting information from multiple sources and combining it into a unified dataset for analysis. It simplifies complexity. It reduces thousands or millions of individual records into structured summaries such as totals, averages, counts, trends, and grouped segments.
Think about sales data pulled from your website, Amazon store, retail POS system, and subscription platform. Individually, those streams are fragmented. Aggregated properly, they reveal total revenue, regional performance, product trends, and seasonality patterns that you can actually use to make decisions.
The real value is clarity. Aggregation highlights relationships inside the data and exposes patterns that remain invisible when you look at isolated entries. It can be automated through analytics platforms and pipelines, or handled manually for smaller datasets. The principle stays the same. Combine. Structure. Simplify.
Why Data Aggregation Is So Crucial
Unorganized data is expensive. It wastes analyst time, slows decisions, and increases the risk of wrong conclusions. Aggregation prevents that by shifting focus from scattered details to structured insight.
In a business context, aggregated metrics allow leaders to identify performance signals instantly. Instead of manually comparing spreadsheets across departments, you can monitor unified dashboards that show revenue growth, customer acquisition cost, churn rate, or campaign ROI in one view. That speed matters. Decisions made faster often outperform decisions made later, even if both are technically correct.
Aggregation also improves accessibility. When data is summarized into clear indicators, non-technical stakeholders can interpret results without depending entirely on analysts. That reduces bottlenecks and increases transparency across teams.
There is also a technical advantage. Aggregated datasets reduce system load, accelerate reporting, and simplify storage. Instead of repeatedly querying raw transactional databases, you work with pre-processed summaries designed for analysis. It is cleaner. Faster. More scalable.
Common Techniques for Data Aggregation
Different goals require different aggregation techniques. The method you choose should align with the decision you are trying to support.
- Summation: Adds values together to produce totals. Commonly used for revenue, expenses, page views, or units sold. If you need to understand overall performance across channels, start here.
- Averaging: Calculates the mean value across a dataset. Useful for evaluating trends such as average order value, response time, or customer rating. Always check for outliers that may distort the result.
- Counting: Measures frequency. How many purchases were made, how many support tickets were opened, or how many users logged in this week. Counts often reveal growth patterns before revenue does.
- Minimum and Maximum: Identify extremes. These metrics help detect peak load times, highest transaction values, or lowest inventory levels. Particularly useful in operations and risk management.
- Median: Identifies the central value in a sorted dataset. When distributions are uneven, the median often provides a more realistic representation than the average. Examples include income analysis or property pricing.
- Grouping: Organizes data by categories such as region, product type, customer segment, or time period. This enables segmented analysis, where many strategic insights emerge.
Before applying any method, define your objective clearly. Are you tracking performance, forecasting demand, detecting anomalies, or evaluating risk. The answer determines the structure of your aggregation.
Data Aggregation in Practice
Aggregation is not theoretical. It drives everyday decisions across industries.
1. Marketing
Marketing teams work with campaign metrics, traffic sources, CRM data, ad platforms, and website analytics simultaneously. Individually, these tools show partial performance. Aggregated together, they expose full funnel behavior.
When UTM data from ad campaigns is merged with CRM revenue records, marketers can see which channels generate not just clicks, but profit. Drop-off points in the funnel become visible. Budget allocation becomes evidence-based rather than intuitive.
The actionable step is straightforward. Build a centralized reporting layer that connects ad platforms, CRM systems, and web analytics into one dashboard. Review aggregated performance weekly, not monthly, and adjust campaigns based on cost per acquisition and lifetime value rather than vanity metrics.
2. Finance Industry
Banks and fintech firms process millions of transactions daily. Examining single transactions in isolation is inefficient. Aggregation reveals broader behavioral patterns such as average customer spending, peak transaction hours, and abnormal activity clusters.
Fraud detection systems rely heavily on aggregated signals. Sudden deviations from historical averages can trigger alerts within minutes. Aggregated financial data also supports regulatory reporting, internal auditing, and revenue forecasting.
If you operate in finance, implement real-time aggregation pipelines that continuously update risk indicators. Waiting for batch reports can delay critical intervention.
3. IT and Systems Analysis
IT teams manage infrastructure metrics, server loads, latency logs, and error rates. Raw logs are overwhelming. Aggregated performance indicators provide a structured overview of system health.
By grouping metrics by time intervals and environment types, teams can identify peak usage windows, recurring failure patterns, and resource bottlenecks. This improves scaling decisions and reduces downtime.
For DevOps environments, integrate log aggregation tools that summarize errors by frequency and severity. Review trends weekly to anticipate system strain before it becomes an outage.
Across all these cases, aggregation transforms fragmentation into structure. It enhances forecasting accuracy and accelerates decision cycles. Most importantly, it reduces guesswork.
How Proxies Enhance Large-Scale Data Aggregation
When aggregation depends on collecting data from multiple external sources, stability and privacy become critical. This is where proxy infrastructure plays a strategic role.
- Distribute Requests: Proxies spread traffic across multiple IP addresses, lowering the risk of throttling or blocking when accessing public data sources. By avoiding concentration on a single endpoint, organizations reduce visibility risks and maintain consistent data flow.
- Protect Internal Infrastructure: Proxies mask internal IP addresses, preventing direct exposure of core systems. This separation strengthens security posture and minimizes the attack surface tied to data operations.
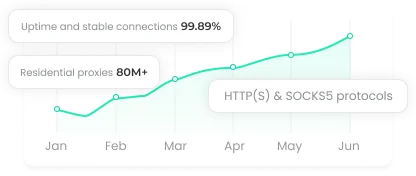
- Enable Secure Large-Scale Monitoring: For companies tracking competitor pricing, analyzing international markets, or aggregating publicly available web data, proxies ensure reliable access at scale. Success depends on selecting the appropriate proxy type, aligning geographic locations with business needs, and maintaining dependable uptime.
- Balance High-Volume Traffic: Heavy data collection can overwhelm a single connection and trigger rate limitations. Proxies distribute request loads, stabilize traffic patterns, and reduce interruptions caused by repetitive access signals.
- Support Region-Specific Visibility: When analytics require insight into geographically segmented platforms, proxies enable lawful access to regionally restricted public data without compromising internal systems.
If aggregation is part of your growth strategy, infrastructure planning should include privacy safeguards and distributed connectivity. Ignoring that layer can undermine the entire analytics pipeline.
Final Thoughts
Effective data aggregation turns chaos into clarity, powering faster, smarter decisions across every business function. When combined with reliable proxy infrastructure, it ensures secure, scalable, and actionable insights—transforming raw numbers into a strategic advantage you can trust.
About the author
Related articles


- Please provide your account number, or email address.
- Provide videos or screenshots, and simply describe the problems you are facing.
- Our staff will reply to your message within 24 hours.